The Mathematics of Earned Value Management, Part - I
Project
Management is playing an important role in today’s organizations. As companies restructuring
itself from hierarchical structure to more horizontal structures, more people
with project management skills are needed. Project Management is required in
various business segment, from high-end information technology to real-estate
companies. This skill helps the organization, in order to launch the new products
on time and in budget, and to coordinate people within the organization.
Unlike,
other management disciplines, modern project management is pretty new. It first
started to be used in the USA by government programs in 1950s, but it has been
used widely in all sectors beginning from 1990s and it still improves. Today,
it is seen that although human skills are important in order to establish the
necessary coordination between people and departments, technical skills are
equally important to measure the project performance objectively and to take
necessary actions.
Here
I will concentrate on an important mathematical project management technique
“Earned Value Management”, which is a pain area for newly appointed Project
Managers.
At
the very beginning I will discuss some necessary concepts about project
management. In the following parts I will discuss the concept of project
management constraints and it association with the “Earned Value Management”
technique.
INTRODUCTION TO PROJECT MANAGEMENT
PROJECT
MANAGEMENT INSTITUTE
Project
Management Institute (PMI, www.pmi.org)
is a not-for-profit professional association, whose goal is to advance the
practice, science, and profession of project management throughout the world in
order organizations to embrace value and utilize project management and then
attribute their success to it.
PMI
was founded in 1969 by working project managers. Today the association has approx
420,000 members and credential holders. PMI organize the project management
frame work in a structural way under “A Guide to Project Management Body of
Knowledge (PMBOK Guide)”.
In
this study, all the concept descriptions will be given based on PMI standards.
DEFINITION OF PROJECT AND
PROJECT MANAGEMENT
Project
is:
- A
temporary endeavor i.e. with a definite beginning and an end,
-
Creates a unique product, service or result,
- And
progressively elaborated (the characteristics of each unique project will be
progressively detailed as the project progress).
Project
Management is the discipline of planning, organizing and managing the resources
to bring about the successful completion of specific project goals and
objectives.
The projects need to be managed and delivered under certain
constraints. Traditionally, these constraints have been listed as scope, time
and cost. The time constraint refers to the amount of time available to
complete a project. The cost constraint refers to the budgeted amount available
for the project. The scope constraint refers to what must be done to produce
the project’s end result. These are also
referred as the “Project Management Triangle”, where each side represents a
constraint. Now, if one side of the triangle change then other sides of the
triangle change automatically. For example if we change the scope of the
project then it effect the both the time and cost of the project.

Figure 1: Project
Constraints “Triple Constraint”
The Project Management
Institute divided the entire project into nine project management knowledge
areas :
1. Scope,
2. Time,
3. Cost,
4. Quality,
5. Human Resources,
6. Communications,
7. Risk,
8. Procurement,
9. Integration.
(Project Management Institute,
PMBOK Fourth Edition)
The Project Management
Institute divided the projects in five process groups as given below:
1. Initiating
2. Planning
3. Executing
4. Monitoring and Controlling
5. Closing
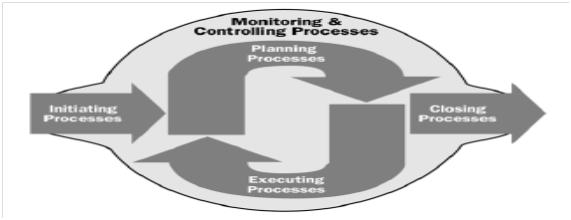
Figure
2: Single Phase Project Management Process Groups Mapped to Plan-Do-Check-Act (Project
Management Institute, PMBOK Fourth Edition)
From the above picture we can
understand how the process groups of the project management interact with each
other for single phase project. For any
multi phase project this cycle may occur several times.

The key of any successful
project is planning. And this begins with, defining the project objective into
detail information. At first we define project scope of work in terms of
deliverables then we further decompose this deliverables into component. This
process is known as Work Breakdown Structure. The WBS creation process is
necessary for subdividing the major project deliverables and project work into
smaller, more manageable components.
To
reach the activity level we further break down WBS, an activity level is small
enough to estimate, schedule, monitor and manage. Then these activities are
sequenced; on the basis of this sequence, resources are allocated, schedule is
made and ultimately cost estimates are made. Parallel to these, project manager
also creates; quality plan, communications plan, risk management plan and procurement
plan (if necessary for the project).

Figure 3: A project WBS example. ( Inspired by “Practice Standard for
WBS, 2nd Edition, PMI)
Here I will discuss the mathematical
concept of two constraints “time” and “cost” and how it use in project
management.
TIME MANAGEMENT
NETWORK DIAGRAMS
Sequencing
the activities in the project is necessary, activities are sequenced based on
how the work will be performed. The result of the sequenced activities is known
as network diagram. We can draw the network diagram in two ways:
A.
Precedence Diagramming Method
B.
Arrow Diagramming Method
Precedence Diagramming Method (PDM)
Precedence
Diagramming Method is also known as Activity-on-Node (AON). In this method,
nodes represent activities, and arrows
show activity dependencies. There are three type of dependencies, which are as
follows:
Finish-to- start An activity must finish before the successor can
start.
Start-to- start An activity must start before the successor can start.
Finish-to- finish An activity must finish before the successor can
finish.
Start-to-Finish An activity
must start before the successor finish.
Arrow Diagramming Method (ADM)
Arrow Diagramming Methods is
also known as Activity-on-Arrow (AOA). In this method of network diagram, the
arrows are used to represent activities. The nodes (in this case circles)
represent activity dependencies. Any activity (arrow) coming into a node is a
predecessor to any activity leading the node.
- It
uses only finish-to-start relationships between activities.
-
May use dummy activities. Dummies are usually represented by a dotted line and
are
inserted
simply to show dependencies between activities. (Rita Mulcahy)

ACTIVITY DURATION ESTIMATION
Once
activity defined, the next process is to define, the amount of time each
activity is expected to take. There are few techniques are used to calculate
the estimation. The techniques are as follows :
• One-Time
Estimate: When
estimating using a one-time estimate, one estimate per activity is received.
This estimation required Expert Judgment. One-time estimates should only be
used for projects that do not require a detailed, highly probable schedule.
• Analogous Estimating: Analogous
estimation is based on the expert judgment and historical information e.g. if
an activity took 5 days to complete then it is assume the activity will take 5
days to in this new project.
Parametric
Estimation: In this
process we calculate project duration from historical data or from other date which involve more statistical
data like e.g. time(days) taken by individual to design each module.
• Three-Point Estimates: We
must understand that statistically there is a very small probability of
completing a project on any one date. Therefore, time estimates for an activity
or a project must be in a range. In this form of estimating the activity
provides an optimistic (O), pessimistic (P) and most likely (M) estimate for
each activity. The resulting estimates for an activity will be stated like 10
days plus or minus 4 days, which means that the activity will take anywhere
from 6 to 14 days.
• Heuristics: This is rule of thumb. It is like requirement
study take 30 percent of the entire project duration.
After duration estimates are
made, we have to make the whole project duration and schedule estimation. There
are two widely methods are in use:
·
Critical Path method
·
PERT methods.
CRITICAL
PATH METHOD:
The
critical path method includes determining the longest path in the network
diagram which is known as CRITICAL PATH and the earliest and latest an activity
can start and the earliest and latest it can be finished. An example will be
helpful to define this concept:
Example : A Project has the activities and durations given
below :
Activity
|
Preceding Activity
|
Estimate in Months
|
A
|
Start
|
2
|
B
|
Start
|
4
|
C
|
Start
|
2
|
D
|
C
|
3
|
E
|
A
|
7
|
F
|
G,E
|
5
|
G
|
B
|
6
|
H
|
D
|
4
|
I
|
F,H
|
6
|
On
the basis of the above data following network diagram is created.

Now
here there three path through we can reach from start to finish.
1. AàEàFàI and duration of this path is 2+7+5+6 = 20
2. BàGàFàI and the
duration of this path is 4+6+5+6 =21
3. CàDàHà and the duration of this path is 2+3+4+6 = 15
The
longest path in the Network Diagram is known as Critical Path, So from the
above calculation we can easily conclude that the path BàGàFàI is the longest path
in the network diagram so it is the critical path.
In
the Network Diagram there is an important concept which is called Float or
Slack. Float or Slack gives the flexibility to the project. All the activity on
the critical path has zero float but
it is not necessary that, if an activity has zero float then it lay on the critical path.
Free Float: An amount of time an activity can be delayed without
delaying its immediate activity (s).
Total Float: An amount of time an activity can delay without
delaying the project end and nearby milestone date.
Project Float: An amount of time an activity can delay without
delaying the project end date as imposed by the project sponsor or high level
committee.
PERT (PROGRAM EVALUATION AND
REVIEW TECHNIQUE):
The
Project Evaluation and Review Technique or PERT is a method to analyze the
involved tasks in completing a given project, especially the time needed to
complete each task and identifying the minimum time needed to complete the
entire project. It was developed primarily to help to simplify the planning and
scheduling of large and complex projects. In order to find the duration and
standard deviation for a project, PERT estimates for each activity on the critical
path should be added.
Terminology:
• Optimistic time (O): The minimum possible
time required to accomplish a task, assuming everything proceeds better than
the expectation.
• Pessimistic time (P): The maximum possible
time required to accomplish a task, assuming everything goes wrong.
• Most likely time (M): The best estimate of
the time required to accomplish a task, assuming everything proceeds as normal.
• Expected time (duration) : The best estimate
of the time required to accomplish a task, assuming everything proceeds as
normal.
Ø
Expected completion time (duration) =
(P+4*M+O) / 6
Ø
Variance
of an activity (σ2) = (P-O / 6)2
Ø
Standard
deviation of an activity = P-O / 6
• At first, for every activity on the Critical Path,
the Expected Completion Time (Duration) and Variance is calculated.
• Next, Expected Completion Times of all activities
are added to calculate the Expected Completion Time for the whole project.
• Finally, the corresponding variance for each
activity is added to calculate the variance for the overall project.
Activity
|
O
|
M
|
P
|
Expected
Duration
|
Activity
Standard Deviation
|
Activity
Variance
|
Range
of the Estimation
|
Requirement
Studies
|
15
|
20
|
30
|
20.83
|
2.5
|
6.25
|
20.83±2.5
|
Analysis
|
18
|
27
|
38
|
27.33
|
3.33
|
11.11
|
27.33±3.33
|
Designing
|
40
|
63
|
82
|
62.33
|
7
|
49
|
62.33±7
|
Coding
|
45
|
68
|
92
|
68.16
|
7.83
|
61.36
|
68.16±7.83
|
Testing
|
25
|
31
|
44
|
32.16
|
3.16
|
10.02
|
32.16±3.16
|
Packaging
|
10
|
19
|
26
|
18.66
|
2.66
|
7.11
|
18.66±2.66
|
Delivery
|
8
|
14
|
27
|
15.16
|
3.16
|
10.02
|
15.16±3.16
|
Project Duration Calculation :
Total
Expected Duration :
20.81+27.33+62.33+68.16+32.16+18.66+15.16 = 244.66
Project
Variance : 6.25+11.11+49+61.36+10.02+7.11+10.02 = 154.88
Project
Standard of the project = √154.88 = 12.44
Range
of Project Duration = 244.66±12.44
TECHNIQUES TO COMPRESS PROJECT DURATION:
Once the project got delayed from
the schedule baseline and we want to bring back the project in-line of the
schedule or when the customer ask to complete the project earlier than the
scheduled date, then we need to compress the project duration. There few ways
to compress the project duration.
• Fast Tracking
– When we try to complete the activities in parallel that are originally
planned in series on the critical path is known as Fast Tracking. One point to
be remember here, while doing the Fast Tracking we increase the risk of the
project.
• Crashing –
Adding more resources to critical path activities to decrease their duration. Now
from the concept of triple-constraint of project management we can assume that
this way we trade-off between Cost and Time.
• Reducing
SCOPE – This may reduce the both cost and time of the project but this will
decrease the customer satisfaction level.
• Cutting
Quality – By cutting the quality we may save both time and money but at the
same time we increase the risk of the project.